Most problems are dealt with in superficial ways. Very few people and organizations actually arrive at theroot cause of their problems. At Toyota, they employ Root Cause analysis in almost everything they do. One problem solving approach they employ is the A3 Process.
A3 is a paper size, typically 11″ x 17″. There are actually several A3-type paper sizes, and Toyota believes that when you structure your problem solving around 1 page of paper, then your thinking is focused and structured.
Below are the steps of the A3 process, followed by a real-world example of an A3 collaborative problem solving that I was a part of while I spent a short time at Toyota. The steps below are taken from Dr. Durward Sobek‘s very informative site:
Identify Problem or Need
Whenever the way work happens is not ideal, or when a goal or objective is not being met, you have a problem (or, if you prefer, a need). The best problems to work on are those that arise in day-to-day work and prevent you from doing your best.

Understand Current Situation
Before a problem can be properly addressed, one must have a firm grasp of the current situation. To do this, Toyota suggests that problem-solvers:
- Observe the work process first hand, and document observations
- Create a diagram that shows how the work is done – a value stream map will be helpful here.
- Quantify the magnitude of the problem (e.g., % of customer deliveries that are late, # of stock outs in a month, # of errors reported per quarter, % of work time that is value-added); if possible, represent the data graphically.
Root Cause Analysis
Once you have a good understanding of how the process (i.e., the one that needs to be fixed) currently works, it’s time to figure out what the root causes are to the errors or inefficiency. To accomplish this, first make a list of the main problem(s). Next, ask the appropriate “why?” questions until you reach the root cause. A good rule-of-thumb is that you haven’t reached the root cause until you’ve asked “why?” at least five times in series.
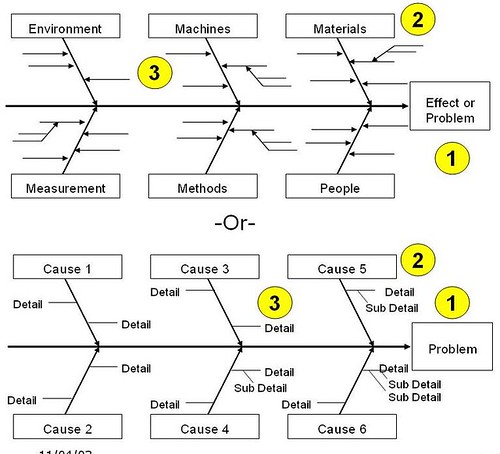


Main Components of an Ishikawa Diagram
- At the head of the Fishbone is the defect or effect, stated in the form of a question.
- The major bones are the capstones, or main groupings of causes.
- The minor bones are detailed items under each capstone.
- There are common capstones, but they may or may not apply to your specific problem. The common ones are:
- People
- Equipment
- Material
- Information
- Methods/Procedures
- Measurement
- Environment
After completing your Fishbone Diagram excercise as a group, it is helpful to test your logic by working the bones: top-down OR bottom-up like:
this happens because of g; g happens because of f; f happens because of e; e happens because of d; d happens because of c; c happens because of b; b happens because of a.
The excercise above is crucially important — you must test your logic so that it makes pragmatic sense and that the atomic root cause is actionable — that is, you can do something to correct it, reduce it, or eliminate the root cause.
Once you or your team arrive at a root cause for a specific capstone, then you typically “cloud” it to identify it as a root cause. A good rule is that there is typically *NOT* 1 root cause for a problem, but potentially several. Below is a diagram of one fishbone, decomposed:

Countermeasures
Once the current situation is fully understood and the root cause(s) for the main problem(s) has been unveiled, it’s time to devise some countermeasures. Countermeasures are the changes to be made to the work processes that will move the organization closer to ideal, or make the process more efficient, by addressing root causes. Generally speaking, we recommend that countermeasures help the process conform to three “rules” borrowed from Steven Spear and Kent Bowen and slightly expanded:
- Specify the outcome, content, sequence, and task of work activities
- Create clear, direct connections between requestors and suppliers of goods and services.
- Eliminate loops, workarounds, and delays
Develop the Target State
The countermeasure(s) addressing the root cause(s) of the problem will lead to new ways of getting the work done, what we call the target condition or target state. It describes how the work will get done with the proposed countermeasures in place. In the A3 report, the target condition should be a diagram (similar to the current condition) that illustrates how the new proposed process will work. The specific countermeasures should be noted or listed, and the expected improvement should be predicted specifically and quantitatively.
Implementation Plan
In order to reach the target state, one needs a well thought-out and workable implementation plan. The implementation plan should include a list of the actions that need to be done to get the countermeasures in place and realize the target condition, along with the individual responsible for each task and a due date. Other relevant items, such as cost, may also be added.
A3 Example
Below is an example from an A3 project. The context for the A3 Report below is around the question “Why was the end-of-shift clean-up not being completed?” This question drove the team to follow the A3 method and subsequent root cause analysis to arrive at the root causes and implement solutions. This activity below was done proactively done by the team with full support from management.
Also, here is a video tutorial showing the elements of an A3 Report, A3 thinking, and how to complete an A3:
Understanding A3 Thinking: A Critical Component of Toyota’s PDCA Management System by Durward Sobek and Art Smalley
Pete Abilla
www.shmula.com
Book Review
MAR 12, 2006
(from Amazon) Winner of a 2009 Shingo Research and Professional Publication Prize. Notably flexible and brief, the A3 report has proven to be a key tool In Toyota’s successful move toward organizational efficiency, effectiveness, and improvement, especially within its engineering and R&D organizations. The power of the A3 report, however, derives not from the report itself, but rather from the development of the culture and mindset required for the implementation of the A3 system. In other words, A3 reports are not just an end product but are evidence of a powerful set of dynamics that is referred to as A3 Thinking.
In Understanding A3 Thinking, the authors first show that the A3 report is an effective tool when it is implemented in conjunction with a PDCA-based management philosophy. Toyota views A3 Reports as just one piece in their PDCA management approach. Second, the authors show that the process leading to the development and management of A3 reports is at least as important as the reports themselves, because of the deep learning and professional development that occurs in the process. And finally, the authors provide a number of examples as well as some very practical advice on how to write and review A3 reports.
I highly recommend this book to lean practitioners in any industry.