Since everything that is in motion must be moved by something, let us suppose there is a thing in motion which was moved by something else in motion, and that by something else, and so on. But this series cannot go on to infinity, so there must be some first mover. – Aristotle, Physics
In a series of events, where people are involved, mistakes happen. Functional areas such software engineering, industrial engineering or more general areas such as medicine, law, or sociology — these areas are composed by a series of events, involving people, process, machines, environment, and other items. Undoubtedly, mistakes will happen.
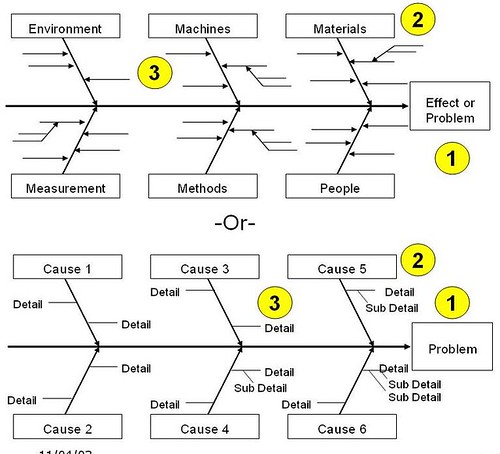
This, more rigorous and long-lasting, approach to solving problems is called Root Cause Analysis. There are several tools that can aid in the process of Root Cause Analysis. One common tool developed by Toyota is called “5-why’s”. Basically, it is a simple approach of asking “why” several times until you arrive at an atomic but actionable item. To visually view the process of the “5-why’s”, a tool called an (Ishikawa Diagram) or a (Cause-and-Effect Diagram) or a (Fishbone Diagram) is often helpful — this tool is referred by either of these.

Main Components of an Ishikawa Diagram
- At the head of the Fishbone is the defect or effect, stated in the form of a question.
- The major bones are the capstones, or main groupings of causes.
- The minor bones are detailed items under each capstone.
- There are common capstones, but they may or may not apply to your specific problem. The common ones are:
- People
- Equipment
- Material
- Information
- Methods/Procedures
- Measurement
- Environment
After completing your Fishbone Diagram excercise as a group, it is helpful to test your logic by working the bones: top-down OR bottom-up like:
this happens because of g; g happens because of f; f happens because of e; e happens because of d; d happens because of c; c happens because of b; b happens because of a.
The excercise above is crucially important — you must test your logic so that it makes pragmatic sense and that the atomic root cause is actionable — that is, you can do something to correct it, reduce it, or eliminate the root cause.
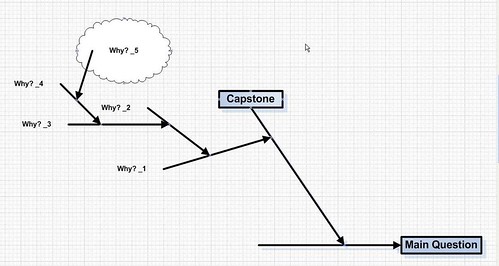
Once you or your team arrive at a root cause for a specific capstone, then you typically “cloud” it to identify it as a root cause. A good rule is that there is typically *NOT* 1 root cause for a problem, but potentially several. Below is a diagram of one fishbone, decomposed:

Fishbone Diagram: A Few Helpful Hints
- It is helpful to pull many people into the construction of these diagrams, as this ensures enough diversity of thought to make sure you get the righ potential root causes.
- Keep asking “why” until you arrive at something atomic and actionable.
- The purpose of this tool is to answer a question, then brainstorm about how to fix the identified root cause.
- Getting more people involved will give them a sense of ownership — and that sense of ownership is very important because now that they feel part of the process, resistance to change will likely be less of a problem.
Real-World Example of Root Cause Analysis
I once helped a large healthcare organization save several million dollars. This organization had the largest call center in California, handling over 8 million calls per year. These were mostly inbound calls, resulting from some internal mistake that caused people to call. My job was to identify the largest opportunity (call type), why are people calling, and eliminating or reducing the root causes.
After pulling log file data and running this enormous data set against my handy-dandy, home-grown regular expression engine (written in Python), we stratified the data into logical stratifications and identified that the largest number of calls into the call center were calls related to a specific product. This discovery naturally begs the question “why” — i.e., this question forms the head of our fishbone: “Why are x% of calls related to x product type?”
We got a cross-functional team together and proceeded with the Ishikawa excercise and identified several root causes. After running the root causes against a prioritization matrix, we went after the low hanging fruit, then the more difficult root causes after that. The result? We demonstrated a quantifiable reduction of inbound calls of this specific type — a reduction of ~8%, which amounted to over $2 Million Dollars in cost savings.
More Fish To Go Around
Root Cause Analysis can be used anywhere. In software engineering, it can be used to identify the root causes of bugs in code; in industrial engineering, root cause analysis can be used to identify defects in design; in medicine, root cause analysis can be used to arrive at the reasons for mistakes or lack of patient satisfaction.
Root Cause Analysis is a helpful business tool with application to all areas of business and technology. Eliminating or reducing the root cause is much more effective than fixing a symptom. Involving people in the process will ensure buy-in and the elimination of resistance.
