熱門文章

3/31/2011

The Toyota A3 Report

Most problems are dealt with in superficial ways. Very few people and organizations actually arrive at theroot cause of their problems. At Toyota, they employ Root Cause analysis in almost everything they do. One problem solving approach they employ is the A3 Process.

A3 is a paper size, typically 11″ x 17″. There are actually several A3-type paper sizes, and Toyota believes that when you structure your problem solving around 1 page of paper, then your thinking is focused and structured.

Below are the steps of the A3 process, followed by a real-world example of an A3 collaborative problem solving that I was a part of while I spent a short time at Toyota. The steps below are taken from Dr. Durward Sobek‘s very informative site:

Identify Problem or Need

Whenever the way work happens is not ideal, or when a goal or objective is not being met, you have a problem (or, if you prefer, a need). The best problems to work on are those that arise in day-to-day work and prevent you from doing your best.

a3 process, managing to learn, john shook, a3 problem solving

Understand Current Situation

Before a problem can be properly addressed, one must have a firm grasp of the current situation. To do this, Toyota suggests that problem-solvers:

  • Observe the work process first hand, and document observations
  • Create a diagram that shows how the work is done – a value stream map will be helpful here.
  • Quantify the magnitude of the problem (e.g., % of customer deliveries that are late, # of stock outs in a month, # of errors reported per quarter, % of work time that is value-added); if possible, represent the data graphically.

Root Cause Analysis

Once you have a good understanding of how the process (i.e., the one that needs to be fixed) currently works, it’s time to figure out what the root causes are to the errors or inefficiency. To accomplish this, first make a list of the main problem(s). Next, ask the appropriate “why?” questions until you reach the root cause. A good rule-of-thumb is that you haven’t reached the root cause until you’ve asked “why?” at least five times in series.
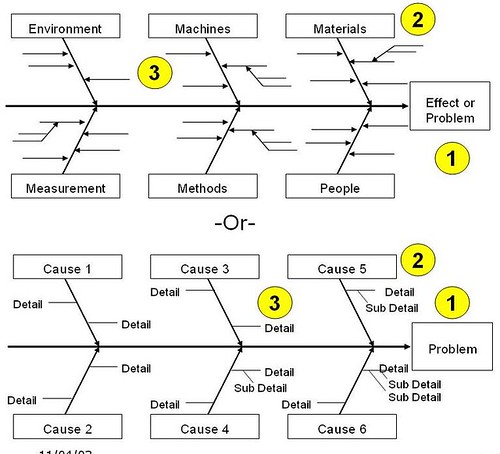
Main Components of an Ishikawa Diagram

  1. At the head of the Fishbone is the defect or effect, stated in the form of a question.
  2. The major bones are the capstones, or main groupings of causes.
  3. The minor bones are detailed items under each capstone.
  4. There are common capstones, but they may or may not apply to your specific problem. The common ones are:
  • People
  • Equipment
  • Material
  • Information
  • Methods/Procedures
  • Measurement
  • Environment

After completing your Fishbone Diagram excercise as a group, it is helpful to test your logic by working the bones: top-down OR bottom-up like:

this happens because of g; g happens because of f; f happens because of e; e happens because of d; d happens because of c; c happens because of b; b happens because of a.

The excercise above is crucially important — you must test your logic so that it makes pragmatic sense and that the atomic root cause is actionable — that is, you can do something to correct it, reduce it, or eliminate the root cause.

Once you or your team arrive at a root cause for a specific capstone, then you typically “cloud” it to identify it as a root cause. A good rule is that there is typically *NOT* 1 root cause for a problem, but potentially several. Below is a diagram of one fishbone, decomposed:
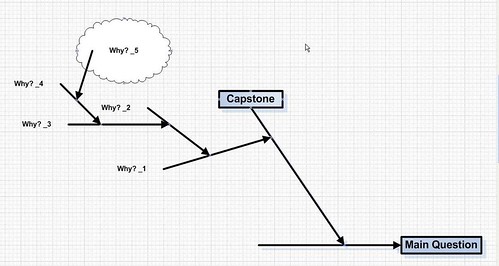
ishikawa, fishbone, shmula.com


Countermeasures

Once the current situation is fully understood and the root cause(s) for the main problem(s) has been unveiled, it’s time to devise some countermeasures. Countermeasures are the changes to be made to the work processes that will move the organization closer to ideal, or make the process more efficient, by addressing root causes. Generally speaking, we recommend that countermeasures help the process conform to three “rules” borrowed from Steven Spear and Kent Bowen and slightly expanded:

  • Specify the outcome, content, sequence, and task of work activities
  • Create clear, direct connections between requestors and suppliers of goods and services.
  • Eliminate loops, workarounds, and delays

Develop the Target State

The countermeasure(s) addressing the root cause(s) of the problem will lead to new ways of getting the work done, what we call the target condition or target state. It describes how the work will get done with the proposed countermeasures in place. In the A3 report, the target condition should be a diagram (similar to the current condition) that illustrates how the new proposed process will work. The specific countermeasures should be noted or listed, and the expected improvement should be predicted specifically and quantitatively.

Implementation Plan

In order to reach the target state, one needs a well thought-out and workable implementation plan. The implementation plan should include a list of the actions that need to be done to get the countermeasures in place and realize the target condition, along with the individual responsible for each task and a due date. Other relevant items, such as cost, may also be added.

A3 Example

Below is an example from an A3 project. The context for the A3 Report below is around the question “Why was the end-of-shift clean-up not being completed?” This question drove the team to follow the A3 method and subsequent root cause analysis to arrive at the root causes and implement solutions. This activity below was done proactively done by the team with full support from management.

Also, here is a video tutorial showing the elements of an A3 Report, A3 thinking, and how to complete an A3:

Understanding A3 Thinking: A Critical Component of Toyota’s PDCA Management System by Durward Sobek and Art Smalley
Pete Abilla
www.shmula.com
Book Review
MAR 12, 2006
Rating: 5/5

(from Amazon) Winner of a 2009 Shingo Research and Professional Publication Prize. Notably flexible and brief, the A3 report has proven to be a key tool In Toyota’s successful move toward organizational efficiency, effectiveness, and improvement, especially within its engineering and R&D organizations. The power of the A3 report, however, derives not from the report itself, but rather from the development of the culture and mindset required for the implementation of the A3 system. In other words, A3 reports are not just an end product but are evidence of a powerful set of dynamics that is referred to as A3 Thinking.

In Understanding A3 Thinking, the authors first show that the A3 report is an effective tool when it is implemented in conjunction with a PDCA-based management philosophy. Toyota views A3 Reports as just one piece in their PDCA management approach. Second, the authors show that the process leading to the development and management of A3 reports is at least as important as the reports themselves, because of the deep learning and professional development that occurs in the process. And finally, the authors provide a number of examples as well as some very practical advice on how to write and review A3 reports.

I highly recommend this book to lean practitioners in any industry.

Since everything that is in motion must be moved by something, let us suppose there is a thing in motion which was moved by something else in motion, and that by something else, and so on. But this series cannot go on to infinity, so there must be some first mover. – Aristotle, Physics

In a series of events, where people are involved, mistakes happen. Functional areas such software engineering, industrial engineering or more general areas such as medicine, law, or sociology — these areas are composed by a series of events, involving people, process, machines, environment, and other items. Undoubtedly, mistakes will happen.

What typically happens in response to mistakes is that blame is thrown around, which builds resistance, then communication fails which could lead to project failure. The better approach is to identify the root causes of mistakes and attacking that, instead of what might be perceived as the cause: Perceived causes are most likely symptoms and not the root cause, in which case the problem was never really solved.

This, more rigorous and long-lasting, approach to solving problems is called Root Cause Analysis. There are several tools that can aid in the process of Root Cause Analysis. One common tool developed by Toyota is called “5-why’s”. Basically, it is a simple approach of asking “why” several times until you arrive at an atomic but actionable item. To visually view the process of the “5-why’s”, a tool called an (Ishikawa Diagram) or a (Cause-and-Effect Diagram) or a (Fishbone Diagram) is often helpful — this tool is referred by either of these.

ishikawa diagram

Main Components of an Ishikawa Diagram

  1. At the head of the Fishbone is the defect or effect, stated in the form of a question.
  2. The major bones are the capstones, or main groupings of causes.
  3. The minor bones are detailed items under each capstone.
  4. There are common capstones, but they may or may not apply to your specific problem. The common ones are:
  • People
  • Equipment
  • Material
  • Information
  • Methods/Procedures
  • Measurement
  • Environment

After completing your Fishbone Diagram excercise as a group, it is helpful to test your logic by working the bones: top-down OR bottom-up like:

this happens because of g; g happens because of f; f happens because of e; e happens because of d; d happens because of c; c happens because of b; b happens because of a.

The excercise above is crucially important — you must test your logic so that it makes pragmatic sense and that the atomic root cause is actionable — that is, you can do something to correct it, reduce it, or eliminate the root cause.

Once you or your team arrive at a root cause for a specific capstone, then you typically “cloud” it to identify it as a root cause. A good rule is that there is typically *NOT* 1 root cause for a problem, but potentially several. Below is a diagram of one fishbone, decomposed:

ishikawa, fishbone, shmula.com

Fishbone Diagram: A Few Helpful Hints

  1. It is helpful to pull many people into the construction of these diagrams, as this ensures enough diversity of thought to make sure you get the righ potential root causes.
  2. Keep asking “why” until you arrive at something atomic and actionable.
  3. The purpose of this tool is to answer a question, then brainstorm about how to fix the identified root cause.
  4. Getting more people involved will give them a sense of ownership — and that sense of ownership is very important because now that they feel part of the process, resistance to change will likely be less of a problem.

Real-World Example of Root Cause Analysis

I once helped a large healthcare organization save several million dollars. This organization had the largest call center in California, handling over 8 million calls per year. These were mostly inbound calls, resulting from some internal mistake that caused people to call. My job was to identify the largest opportunity (call type), why are people calling, and eliminating or reducing the root causes.

After pulling log file data and running this enormous data set against my handy-dandy, home-grown regular expression engine (written in Python), we stratified the data into logical stratifications and identified that the largest number of calls into the call center were calls related to a specific product. This discovery naturally begs the question “why” — i.e., this question forms the head of our fishbone: “Why are x% of calls related to x product type?”

We got a cross-functional team together and proceeded with the Ishikawa excercise and identified several root causes. After running the root causes against a prioritization matrix, we went after the low hanging fruit, then the more difficult root causes after that. The result? We demonstrated a quantifiable reduction of inbound calls of this specific type — a reduction of ~8%, which amounted to over $2 Million Dollars in cost savings.

More Fish To Go Around

Root Cause Analysis can be used anywhere. In software engineering, it can be used to identify the root causes of bugs in code; in industrial engineering, root cause analysis can be used to identify defects in design; in medicine, root cause analysis can be used to arrive at the reasons for mistakes or lack of patient satisfaction.

Root Cause Analysis is a helpful business tool with application to all areas of business and technology. Eliminating or reducing the root cause is much more effective than fixing a symptom. Involving people in the process will ensure buy-in and the elimination of resistance.

“Ask ‘Why’ Five Times About Every Matter”

Taiichi Ohno is known to have said that “having no problems is the biggest problem of all.” He viewed problems not as a negative but as a “Kaizen opportunity in disguise.” Whenever problems arose, he encouraged his staff to investigate the problem at the source and to as “ask ‘why’ five times about every matter (src).”

In a series of events, where people are involved, mistakes happen. Functional areas such software engineering, industrial engineering or more general areas such as medicine, law, or sociology — these areas are composed by a series of events, involving people, process, machines, environment, and other items. Undoubtedly, mistakes will happen. What typically happens in response to mistakes is that blame is thrown around, which builds resistance, then communication fails which could lead to project failure. The better approach is to identify the root causes of mistakes and attacking that, instead of what might be perceived as the cause: Perceived causes are most likely symptoms and not the root cause, in which case the problem was never really solved. This, more rigorous and long-lasting, approach to solving problems is called Root Cause Analysis.

Ohno was fond of using the following example to illustrate Root Cause Analysis:

1. “Why did the robot stop?”
The circuit has overloaded, causing a fuse to blow.
2. “Why is the circuit overloaded?”
There was insufficient lubrication on the bearings, so they locked up.
3. “Why was there insufficient lubrication on the bearings?”
The oil pump on the robot is not circulating sufficient oil.
4. “Why is the pump not circulating sufficient oil?”
The pump intake is clogged with metal shavings.
5. “Why is the intake clogged with metal shavings?”
Because there is no filter on the pump.

There are several tools that can aid in the process of Root Cause Analysis. Basically, it is a simple approach of asking “why” several times until you arrive at an atomic but actionable item. To visually view the process of the “5-why’s”, a tool called an (Ishikawa Diagram) or a (Cause-and-Effect Diagram) or a (Fishbone Diagram) is often helpful — this tool is referred by either of these.

ishikawa diagram

Main Components of an Ishikawa Diagram

  1. At the head of the Fishbone is the defect or effect, stated in the form of a question.
  2. The major bones are the capstones, or main groupings of causes.
  3. The minor bones are detailed items under each capstone.
  4. There are common capstones, but they may or may not apply to your specific problem. The common ones are:
  • People
  • Equipment
  • Material
  • Information
  • Methods/Procedures
  • Measurement
  • Environment

After completing your Fishbone Diagram excercise as a group, it is helpful to test your logic by working the bones: top-down OR bottom-up like:

this happens because of g; g happens because of f; f happens because of e; e happens because of d; d happens because of c; c happens because of b; b happens because of a.

The excercise above is crucially important — you must test your logic so that it makes pragmatic sense and that the atomic root cause is actionable — that is, you can do something to correct it, reduce it, or eliminate the root cause.

Once you or your team arrive at a root cause for a specific capstone, then you typically “cloud” it to identify it as a root cause. A good rule is that there is typically *NOT* 1 root cause for a problem, but potentially several. Below is a diagram of one fishbone, decomposed:

ishikawa, fishbone, shmula.com

A Few Helpful Hints

  1. It is helpful to pull many people into the construction of these diagrams, as this ensures enough diversity of thought to make sure you get the righ potential root causes.
  2. Keep asking “why” until you arrive at something atomic and actionable.
  3. The purpose of this tool is to answer a question, then brainstorm about how to fix the identified root cause.
  4. Getting more people involved will give them a sense of ownership — and that sense of ownership is very important because now that they feel part of the process, resistance to change will likely be less of a problem.

Real-World Example of Root Cause Analysis

I once helped a large healthcare organization save several million dollars. This organization had the largest call center in California, handling over 8 million calls per year. These were mostly inbound calls, resulting from some internal mistake that caused people to call. My job was to identify the largest opportunity (call type), why are people calling, and eliminating or reducing the root causes.

After pulling log file data and running this enormous data set against my handy-dandy, home-grown regular expression engine (written in Python), we stratified the data into logical stratifications and identified that the largest number of calls into the call center were calls related to a specific product. This discovery naturally begs the question “why” — i.e., this question forms the head of our fishbone: “Why are x% of calls related to x product type?”

We got a cross-functional team together and proceeded with the Ishikawa excercise and identified several root causes. After running the root causes against a prioritization matrix, we went after the low hanging fruit, then the more difficult root causes after that. The result? We demonstrated a quantifiable reduction of inbound calls of this specific type — a reduction of ~8%, which amounted to over $2 Million Dollars in cost savings.

Facts Versus Data

Ohno seems to see a difference in the two. In his words,

“The root cause of any problem is the key to a lasting solution,” Ohno used to say. He constantly emphasized the importance of genchi genbutsu, or ‘going to the source,’ and clarifying the problem with one’s own eyes. ”‘Data’ is of course important in manufacturing,” he often remarked, “but I place greatest emphasis on ‘facts.’”

I believe what he means is that data, is a degree removed from the actual place where the phenomena is happening. He placed a greater value on being where the work is done and where value is added. Whereas data is often on a computer screen or on paper. He preferred to be at the source of the phenomena.

More Fish To Go Around

Root Cause Analysis can be used anywhere. In software engineering, it can be used to identify the root causes of bugs in code; in industrial engineering, root cause analysis can be used to identify defects in design; in medicine, root cause analysis can be used to arrive at the reasons for mistakes or lack of patient satisfaction.

Root Cause Analysis is a helpful business tool with application to all areas of business and technology. Eliminating or reducing the root cause is much more effective than fixing a symptom. Involving people in the process will ensure buy-in and the elimination of resistance.

Creating an Improvement Culture

Ohno believed that by empowering each associate to have ownership and improve their work and the Gemba, that is how innovation is achieved and a culture of improvement is created — it is empowering your people to make the right changes using the tools that work — Root Cause Analysis is one of the tools that can help empower your employees and help to create a culture of improvement throughout your enterprise. One item missed by most people is that Toyota doesn’t just build cars, but it also builds people. Root Cause Analysis is an effective tool that helps associates feel empowered to make their everyday work better.


3/29/2011

趣味....大陸地震局公告

大陸國家地震局嚴正公告:

一、

今年到後年,不震就不震,震了就震了,震多少級,震後才知道,
震多少次,震後會告訴大家,請大家放心!


二、

害怕的就出去睡,不害怕的就在家裏睡,並保持正常生活秩序,不要沒事瞎傳謠言,搞的我們也好恐怖!


三、
儘快把多餘的房子賣掉,地震來了才知道,不動產原來也會動的,而且動起來嚇死人!


四、防震應有的常識:
(一)、初一在家睡,十五在帳篷睡,
因為躲得過初一躲不過十五
(二)、可以出家當和尚,但不能睡在廟裏,
因為跑得了和尚跑不了廟
(三)、買房子要麼選一樓,要麼選頂樓,
一樓逃的快,頂樓被挖出來快


五、

大家不要擔心日本核電站的輻射,這麼多年來,我們吃三聚氰胺奶粉、毒大米,喝地溝油是為了什麼呀?就是在下一場生化戰爭中活下來啊!不要害怕,不要擔心,就當一場日光浴好了。

況且,我們來到這個世上,就沒打算活著回去!


六、

有人咋呼說擔心核輻射,嚷嚷著要吃碘,我看沒必要先吃蘿蔔淡操心,敵敵畏蘇丹紅三聚氰胺你身體裏哪一樣沒有?
把你劈碎了攤地上就是一張元素週期表,還吃什麼碘


七、

最近出現搶鹽風潮,是讓國人集體丟臉,在此呼籲大家真的不要瘋狂搶鹽。

轉達中央發的對聯,
上聯是「日本大核民族」,下聯是「中國鹽荒子孫」,橫批為「有碘意思」。


八、

我們不要:「日本人地震沒死,海嘯沒死,核輻射沒死,結果當聽說中國人瘋搶食用鹽後,全部笑死了!」


九、

世上最痛苦的是什麼?輻射來了,鹽沒了;
世上最最痛苦的是什麼?輻射來了,吃鹽沒用;
世上最最最痛苦的是什麼?輻射沒來,鹽買太多了;
世上最最最最痛苦是什麼?人都死了,鹽還沒用完」。


十、中央如再有新的指示,隨時公告。

人生如棋

人生如棋

一九二五年,芝加哥白水灘飯店(White? WATER Beach Hotel)舉行了一場重要的會議,與會者都是各行各業的頂尖人物,包括全美最大鋼鐵公司總經理、最大電力公司總經理、最大瓦斯公司總經理、紐約證券交易所總經理、聯邦政府部長、爾街響叮噹的投資高手、最大交通運輸公司總經理、國際商銀總經理。

這些人都很會賺錢,這次聚會的目的,也正是討論如何創造更多財富。

這些人後來過得如何呢?或許你跟我一樣好奇。

二十五年後,果真有人興致勃勃地作調查,結果驚訝地發現:

鋼鐵公司總經理去世前五年是借債度日的;電力公司總經理一文不名地死在外國的小島上;瓦斯公司總經理成了精神病患者;紐約證券交易所總經理剛從辛辛監獄關出來;聯邦政府部長剛得到美國總統特赦,總算能死在家裡;華爾街投資高手和交通運輸公司總經理、國際商業銀行總經理都自殺了!

十個頂尖人物,竟沒有一個人能得善終。

他們為什麼把自己的人生搞得一團糟?

我並不確知詳情,卻很感慨,會賺錢的人,不一定會生活;工作能力強的,不一定懂得克服情緒壓力;絕頂聰明的優等生,不一定能夠自我調適。

在台灣有多少這樣的人?

努力賺錢、衝刺事業、用功讀書,卻因為不懂得如何克服緊張、壓力、焦慮、憂 愁,所有的付出,到最後是一場空,只換來失去健康、失去平靜、失去快樂。

活得這麼辛苦,究竟是為什麼?

只要願意,其實每個人都能把自己從不幸、痛苦的深淵解救出來,快樂絕對可以操之在我,端視你如何面對、處理發生在自己身上的事。

記得三年前,我和十幾個美國卡內基講師一起到蒙大拿滑雪。

很巧地,有兩位講師的妻子都是才剛過世不久,其中一人,沿途都鬱鬱寡歡,另一人卻是活潑開朗,玩得比誰都盡興,而大家都知道,他與妻子向來十分恩愛。

我感觸很深,類似的境遇發生在不同人身上,反應也截然不同。

這讓我想起一段印象非常深刻的電影情節。

冰天雪地中,女主角在凍結的湖上快樂盡情的溜冰,坐在湖畔重病已久的丈夫,凝視著心愛的妻子,安然闔上雙眼。

接下來的日子一片忙亂,親友們前來幫忙喪偶的女主角,照顧小嬰兒、安排生活、處理瑣事......

女主角的姊姊心疼妹妹的遭遇,悲傷流淚,但女主角反而微笑安慰姊姊說:

「我曾經擁有一段美麗的時光,這已足夠!」

看到這一幕,我不由自主流下淚來。

當時我就想,萬一有一天,我遭遇重大的災難痛苦,也要告訴自己:
「我曾經快樂充實地生活過,這就夠了。」

我深深確信,人真的可以改變想法,來克服憂慮、恐懼、甚至各種病痛,進而改變人生。

生活需要平衡發展,建立良好的人際互動,特別是相互激勵,相互瞭解,相互分享,相互原諒。

學會感恩、寬恕,活在每一個當下,以正向積極的人生態度,微笑迎接命運給我們的每一個挑戰。

事實上,你我都不需要再學什麼新觀念,我們所認知的已足夠引導我們享受快樂的人生。

我們並非無知,只是知而未行。

當你遭遇困境,不知所措時,與其焦慮,不如試試魔術方程式的三個步驟,和解決煩惱問題的三個原則,你將發現事情沒那麼糟,總有改善最壞狀況的方法。

如果情勢真的無法挽回,那麼就接受它!

已經盡力就夠了,其他的交給上蒼吧!

(克服憂慮的魔術方程式,其實只有簡單的三個步驟:
1.
問自己:最壞的狀況是什麼?
2.
接受最壞的狀況
3.
設法改善最壞的狀況)

相信我,你真的可以做到。

當你不小心又跌入憂煩時,與其惱怨命運的不公平,不如盤算你所得到的恩惠,你將發現自己原來是很有福氣的。

俗話說:「人人頭上一片天,歹歹馬,也會一步踢。」

再貧弱的人,也有自己的強項,振作起來,去忙一些建設性的事,茁壯自我你就會愈來愈幸運,愈來愈有福氣。

相信我,你一定可以做到。

不心存報復,不斤斤計較得失,不期待他人的感恩,只享受付出的快樂,並在為人創造喜悅的同時,豐富自己的人生。